
How to Draw Contour Plot for Gradient Descent in Python
-
date_range Jan. 17, 2019 - Thursday infosortPythonlabelpythonhow-tomachine learning
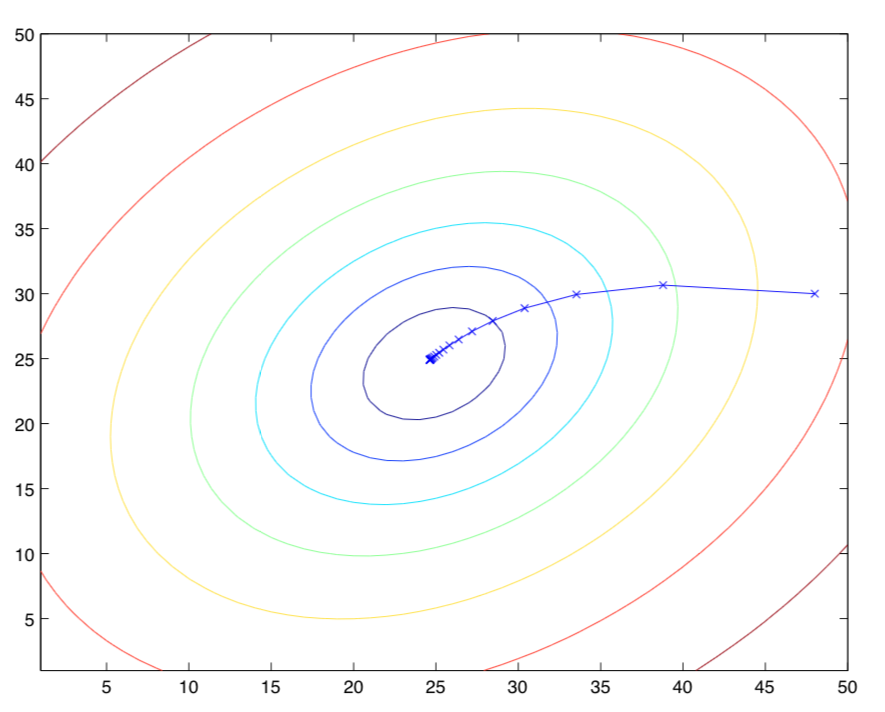
The contour plot that showing the path of gradient descent often appears in the introductory part of machine learning. The following plot is an classic example from Andrew Ng’s CS229. In this article, I’d like to try and take a record on how to draw such a Gradient Descent contour plot in Python.
Reference
» How to visualize Gradient Descent using Contour plot in Python - Abhisek Jana
» The mplt3d Toolkit - matplotlib Official
» 3d Plotting examples - matplotlib Official
KF